.
|
|
| Home | About | Blog |Books| Contact |Links |Legal |Privacy |Testimonials |
| . |
|
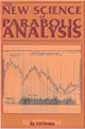
The New Science of Parabolic Analysis From the author: "For years I've been asked by my readers if there was a book available on how to use parabolic curves to forecast price moves in stocks and commodities like I do in my newsletters and financial commentaries. Until now I've had to tell them "no" that is until now. "After many months of preparation I've finally completed what I consider to be a comprehensive kit for traders and investors on how to apply Parabolic Analysis to financial markets. This instruction kit includes my 132-page book, "The New Science of Parabolic Analysis" plus a 12" Curvex flexible curve for drawing the parabolas on price graphs of stocks and commodities (this is the same curve I use in my daily chart analysis and it comes highly recommended). The kit also includes my presentation on parabolic analysis (entitled "New Concepts in Support & Resistance") given at the Chicago Futures & Options Expo in 2000 when I first publicly revealed my methods for forecasting with Parabolic Analysis. "Then, as now, I explained how this fascinating and profitable "science" (discovered by P.Q. Wall and refined by yours truly) can be used with good effect in the day-to-day financial markets. Now it's available in kit form at a very reasonable price and written in language that the average trader can understand. The book contains scores of actual chart examples of how to draw the curves and how to forecast price movements with them. The vast majority of chart examples provided in the book were taken from my past commentaries and newsletters over the last 1-3 years. These are actual, real-time forecasts and not after-the-fact, "curve-fitted" examples. These real-life successful chart forecasts prove that Parabolic Analysis is for real and not just another crack-pot theory of technical analysis." With each kit you get:
"The New Science of Parabolic Analysis" also contains numerous chart examples of how Parabolic Analysis can be applied to forecast gold and gold stock prices, among many other stock and commodity markets. This extraordinary advance in technical analysis goes beyond the outmoded linear way of looking at market (e.g., trend lines, etc.) and focuses on how markets actually trade -- in parabolic fashion. . |

 June
7, 2004
June
7, 2004